32.1 Setting a Breakpoint
First we want to activate the debugger. This can be done in several ways, for example by setting a breakpoint
before starting the test run. The purpose of a breakpoint is to interrupt the test run at a position you want to
examine more closely. As soon as QF-Test hits the breakpoint, test execution is paused and the debugger mode is activated.
The Pause button ![]() is now pressed.
is now pressed.
-
Action
Select a node and press Ctrl+F8 (on macOS: ⇧+⌘+B).
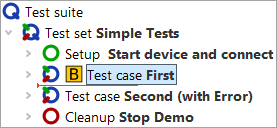
The breakpoint is indicated by the icon
 .
.
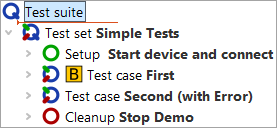
- Action Select the Test suite node and start the test run via the key Enter.
- Action Remove the breakpoint by pressing Ctrl+F8 (on macOS: ⇧+⌘+B) again.
You can set or remove a breakpoint not only via the shortcut Ctrl+F8, but also via the menu »Debugger«-»Breakpoint on/off« or alternatively by right-clicking the node and selecting »Breakpoint on/off« in the popup menu. For the other debugger functions we will mainly refer to the respective buttons, but the other options are available as well.
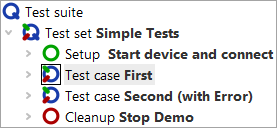
Again you will see the small arrow, this time indicating which node will be executed next. This node is called the current node. When the debugger mode is activated, QF-Test navigates to the current node if it is not already visible and selects it, i.e. the row is highlighted in blue.
The command »Debugger«-»Remove all breakpoints« is also useful if you want to remove all breakpoints in all open test suites.
There is no limit to the number of breakpoints you can set in your test suite. Breakpoints are not saved when the test suite is closed.