32.5 Resolving problems from the run log
Via the Jump to run log button (see error message in figure "Error message") the run log opens directly at the corresponding node.
In addition to the actual error message, various other information about the test environment at the time of the error has been logged. Besides screenshots taken at the time of the error, the run log under the node that caused the error contains a list of bound variables (stacktrace). We will return to the usefulness of the stacktrace later (The "Variable Bindings" Table).
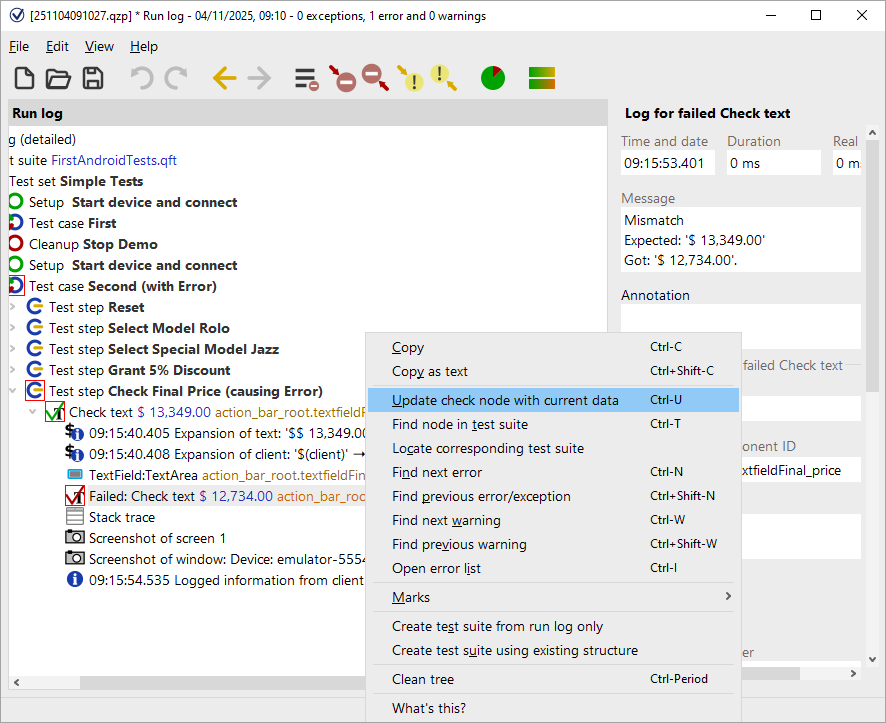
In the present case the wrong value is expected in the Check text node of the test suite. To fix the error this must be replaced by the value actually shown. For a Check with a fixed value, which is the case here, the easiest way is to
- Action right-click the error node with the red border "Failed: Check text: default …" and
- select »Update Check node with received data« in the context menu.

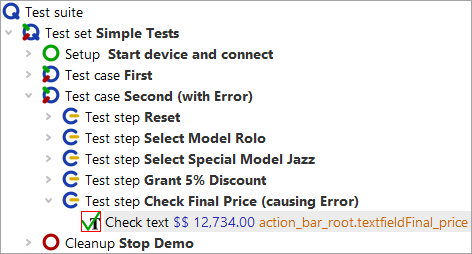
QF-Test navigates to the affected Check text node in the test suite and updates the value of the attribute Text based on the data read from the SUT.

The node now contains the correct value, but it is still marked with a red border because it has not been executed again yet. We will do that now.
-
Action
Continue the test by pressing the Pause button
 to release the pause.
QF-Test executes the rest of the test suite. In our case these are the Check text and the Cleanup nodes. Subsequently QF-Test informs you that an error occurred. However, we already fixed this during the test run.
Jump to run log: If you want to open the run log exactly at the position where test execution is currently paused, simply click the menu item »Debugger«-»Jump to Run log« or press the shortcut Ctrl+J from debugger mode. If you just want to open the run log without jumping to the current position, use Ctrl+L, which also works after the test run has finished.