33.3 Advanced Debugging Using the "Variable bindings" Table
Next, we want to examine the"Variable bindings" table and find out how to use it for debugging. Therefore, please keep the incorrect value that was inserted in the procedure call in the previous section.
We will interrupt the execution of the test case at the procedure call and then step into the procedure. While doing so, we will watch what happens in the "Variable bindings" table. Afterwards we will jump directly from the "Variable bindings" table to the faulty procedure call and correct the parameter value there.
- Action Set a breakpoint at "Procedure call: checkFinalPrice" in the second test case.
- Execute the second test case.
-
When QF-Test stops at the breakpoint, perform two step-ins into the procedure using
 and watch the "Variable bindings" table.
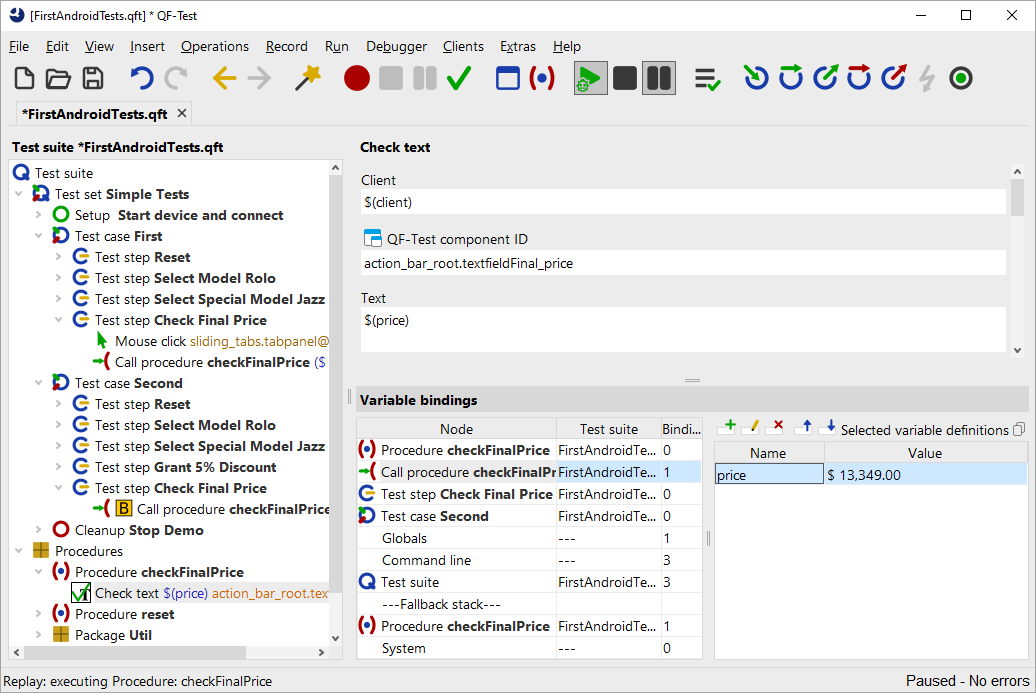
When you step into the procedure, the first step creates a row for "Procedure call: checkFinalPrice" at the top of the table, and the second step creates the row "Procedure: checkFinalPrice".
Now the variable price appears at two different levels in the "Variable bindings" table:
in the row for "Procedure call: checkFinalPrice" and in the row "Procedure: checkFinalPrice" on the secondary stack,
neither of which has the correct value.
In QF-Test you can interactively change the values of variables in the "Variable bindings" table while in debugging mode. You can even add new variables or delete existing ones. You can work with them as long as they are on the variable stack, in our case as long as the procedure is being executed.
Changing the current variable value in the "Variable bindings" table does not adjust the parameter value entered in the procedure call node. The value must be changed explicitly in the procedure call.
The fastest way to get to the procedure call is to double-click the procedure call row (the second row) in the Variable Definitions table. This method is especially helpful when you are debugging large test suites and the node you want to jump to is not visible in the test suite window. Instead of a double-click you can also right-click the row and choose the menu item »Jump to node in test suite«.
- Action Double-click the second row with the procedure call in the "Variable bindings" table.
-
Set the parameter to the correct value, i.e.
12.734,00 €.
Conversely, the current value in the "Variable bindings" table is not changed by this. To achieve that, we need to execute the procedure call again. However, the test execution has already moved past this point.
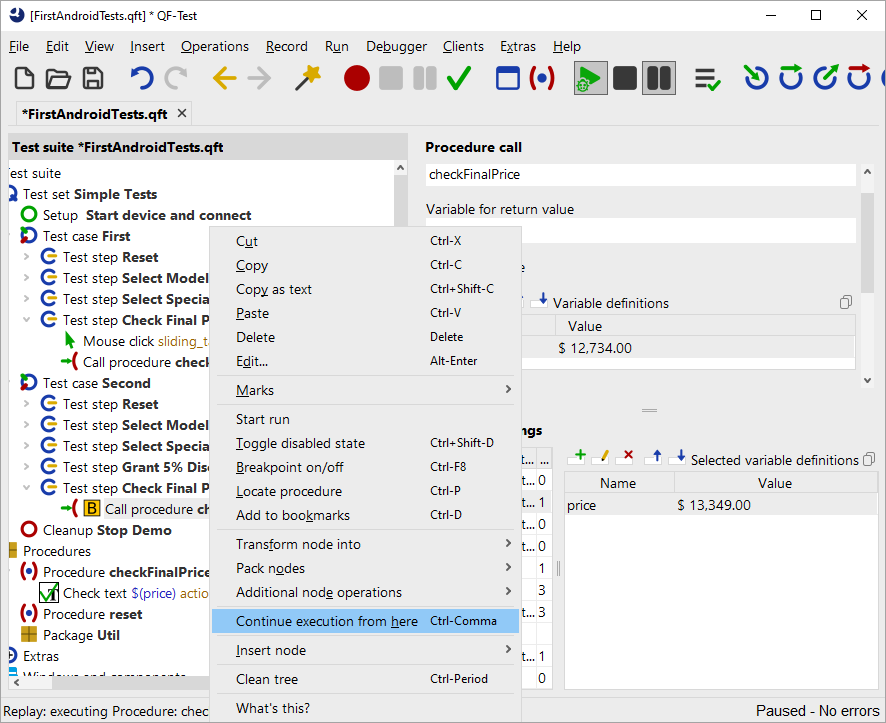
Note Here we want to demonstrate another useful function of the debugger that lets you instruct QF-Test to change the next node to be executed. Select the corresponding node and choose the menu »Continue execution from here« or use the keyboard shortcut Ctrl+,.
So, to try out the newly set value:
- Action Right-click the node "Procedure call: checkFinalPrice" in the second procedure.
- Select "Continue execution from here" in the popup menu.
The two top rows in the "Variable bindings" table have disappeared. The reason is that you have left the procedure (albeit "backwards") and the procedure call with the variables bound to it has been taken off the call stack.
-
Action
Release the pause button
 .
.
No error should appear now.
Note Because the "Variable bindings" table is extremely helpful when hunting for incorrect variable values, a copy of it is also stored under the "Stacktrace" node in the run log, showing the variable values exactly at the time of the error.
Locate current node: Sometimes you drift quite far from the current node while debugging and then want to return to it. The easiest way is to press
"Locate current node" ![]() in the toolbar or choose the menu »Debugger«-»Locate current node«.
in the toolbar or choose the menu »Debugger«-»Locate current node«.