7.1 The run log
During test replay QF-Test creates a run log that records everything that is going on. The
run logs for recent tests are accessible from the »Run« menu, the
current or most recent run log can also be opened by typing Ctrl+L or the respective ![]() button in the toolbar. See "Run log options" for information about options influencing
run log creation.
button in the toolbar. See "Run log options" for information about options influencing
run log creation.
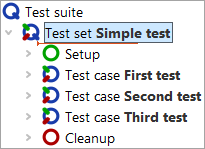
The structure of a run log is similar to that of a test suite, but there are subtle differences. Nodes are added to the run log when they are executed. Setup and Cleanup nodes, for example, are typically executed more than once, in which case multiple copies will be recored in the run log as shown below:
 |
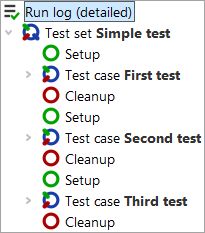 |
| Test suite | Run log |
A run log is the essential resource for determining what went wrong in a test, where it went wrong and maybe even get an idea about why it went wrong. Therefore the emphasis is on completeness of information rather than readability and a run log should not be confused with a report or summary. Report generation is covered in "Reports and test documentation".
In addition to the nodes copied from the test suite, a run log contains failure information, optional annotations, various kinds of messages as well as information about variable expansion and run-time behavior.
The information gathered from a long test run accumulates and can eat up enormous amounts of memory and QF-Test
has several means to cope with that. The best one, which is also the default, is to create split run logs as
described in "Split run logs". The resulting *.qzp files in ZIP format not only
preserve memory on disk - partial run logs can be saved during test execution and removed from memory to free
up necessary space. The same applies when processing logs, e.g. for report creation. The older option
Create compact run log as well as the alternative file formats *.qrz and
*.qrl add flexibility but are mostly retained for compatibility reasons.
7.1.1 Error states
There are three kinds of failures differing in the level of severity:
- Warnings
- Warnings indicate problems that are typically not serious, but might lead to trouble in the future and may need looking at. For example, QF-Test issues a warning, if the best match for a component barely meets the requirements and differs in some significant way.
- Errors
- Errors are considered to be serious defects that require closer inspection. They indicate that the SUT does not fulfill some requirement. A typical cause for an error is a mismatch in a Check text node.
- Exceptions
-
Exceptions are the most serious kinds of errors. An exception is
thrown when a situation occurs in which QF-Test cannot simply
continue with the execution of the test. Most exceptions indicate
problems with the logic of the test, though they can just as well
be caused by the SUT. A
ComponentNotFoundException, for example, is thrown when no component in the SUT matches the intended target for an event. A list of all possible exceptions is available in "Exceptions".
Each node of a run log has an associated state which can be one of normal, warning, error or exception. This state is visually represented by a frame around the node's icon which is orange for warning, red for error and bold red for exception.
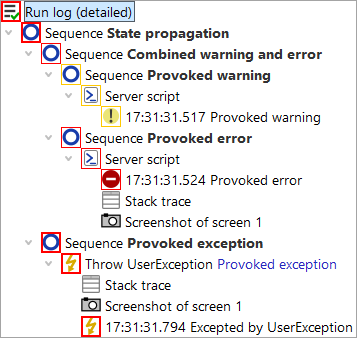
As shown in the (somewhat reduced) screenshot above, error states propagate from bottom to top. The exception state takes precedence over the error state, which in turn overrides warning. The most severe kind of error that propagates to the top of the tree determines the final result of a test and QF-Test's exit code when run in batch mode (see "Exit codes for QF-Test").
If necessary, the propagation of errors can be restricted for all kinds of Sequence nodes with the help of the Maximum error level attribute. This can be useful for sequences which are known to contain errors that should not be taken into account just yet. Exceptions can be handled with the help of the Try and Catch nodes. The Maximum error level attribute of the Catch node determines the state to propagate for a caught exception.
7.1.2 Navigating the run log tree
All of the basic editing methods for a run log are similar to those for a test suite. One significant difference is that can neither add or remove any nodes nor edit the attributes of the nodes copied from the test suite. You can add annotations though, for example to document the reason for an error if it is known.
The first question to answer when looking at a run log is "What happened"?
The ![]() Button, or
»Edit«-»Find next error«, Ctrl+N for short, moves the
selection to the next place at which an error actually occurred.
Button, or
»Edit«-»Find next error«, Ctrl+N for short, moves the
selection to the next place at which an error actually occurred.
Respectively, ![]() or »Edit«-»Find previous error«
(Ctrl+P) moves backwards.
or »Edit«-»Find previous error«
(Ctrl+P) moves backwards.
The option Skip suppressed errors determines whether to ignore errors that didn't propagate up to the root node. There's a menu item shortcut »Edit«-»Skip suppressed errors« to quickly toggle the latter option.
The next question might be "Where did this happen?".
Though a run log is similar in many ways to a test suite, the connection isn't always obvious. The function »Edit«-»Find node in test suite« (Ctrl+T) will take you to the exact node in the test suite that is represented by the selected node in the run log, always provided that the test suite can be located and hasn't changed in a way that prevents this. If the run log is loaded from a file, the corresponding test suite may not be located at the same place as when the test was executed. If the test suite cannot be found, a dialog will pop up that lets you select a different file. In case you select a wrong file or some other test suite is found instead of the one the run log was created from, you may end up at some totally different node, or none at all. In that case you can use the menu item »Edit«-»Locate corresponding test suite« to explicitly change the test suite.
If you want to set the link between the file path of the executed test suite and the file path where you develop the test suite permanently you can do so in the options menu for the log-file as explained in Directory map for test suites.
7.1.3 Run-time behavior
QF-Test tracks the start time and the time spent for each node executed during a test, the latter in two forms: 'Real time spent' is the wall time elapsed between entry and exit of the respective node. It includes explicit delays introduced in nodes via the 'Delay before/after' attribute, user interrupts when debugging tests or other overhead like taking screenshots. The actual time spent testing is collected in the 'Duration' attribute, making it a better indicator for the performance of the SUT.
To get a better understanding of the run-time behavior of a test run you can activate display of duration
indicators via the toolbar button ![]() , the menu »View«-»Show relative duration indicators« or the option Show relative duration indicators. A colored bar is
shown for each node with the length based on the percentage of time spent in the node relative to the time
of its parent node. Bottlenecks in the performance of a test run can be located by drilling down into the
nodes with the longest bars:
, the menu »View«-»Show relative duration indicators« or the option Show relative duration indicators. A colored bar is
shown for each node with the length based on the percentage of time spent in the node relative to the time
of its parent node. Bottlenecks in the performance of a test run can be located by drilling down into the
nodes with the longest bars:
Via the option Duration indicator kind or the sub-menu »View«-»Duration indicator kind« the display can be toggled to show the relative duration, real time or both. The latter is especially helpful but takes a bit of getting used to.
7.1.4 Showing return values
If the option Show return values of procedures is active (in a run log also accessible via the »View« menu), return values of Procedures are displayed in the tree after the respective Procedure call node.
7.1.5 Accepting values of failed checks as good
A noteworthy feature of QF-Test's run log is the ability to quickly accept the actual values of a failed Check node as good. When QF-Test logs a failed Check it includes the complete current state of the Check node's target component in the SUT. This is much more useful than the failure message alone, which, for example, might just tell you that a table column has 10 rows instead of the expected 9, but not what its contents are.
If you are analyzing a failed Check and see that the value in the SUT was actually correct and the expected value stored in the test suite wrong, you can press Ctrl+U or select »Update check node with current data« from the context menu to accept the data from the failed Check as the new correct value for the Check node.
Warning: QF-Test currently doesn't preserve regular expressions in Check text or Check items nodes, they will simply get overwritten.
7.1.6 Split run logs
Run logs for long-running tests can get very large and consume an enormous amount of memory, even more so in case many screenshots are kept. Compact run logs can help, but not enough to make tests that run for days on end possible without turning off the run log entirely. The best way to overcome the memory problem are split run logs.
For split run logs, whenever a certain part of a test has finished, QF-Test takes the run log for that part, removes it from the main run log, saves it to a separate file and replaces it with a single node that references that file. The partial logs are complete run logs in themselves and can be viewed and archived independently, though normally they are accessed through the main run log. When navigating the main run log or when creating reports, QF-Test transparently loads the partial run logs from the separate files as required and removes them from memory when no longer needed. This makes it possible to navigate huge run logs while still retaining a relatively small memory footprint. Of course operations like searching or report creation that need to traverse the whole run log become slower, but jumping from error to error remains quite fast and loading the main run log is sped up drastically.
There are two ways for storing a main run log and its partial logs: All combined
together in a single ZIP file with the extension .qzp or with the partial
logs in a separate directory. The latter is named after the main run log with the
extension .qrl or .qrz removed and the suffix
_logs appended. Inside a .qzp ZIP file the same layout is used
so that it is possible to zip or unzip files manually without breaking the internal
references in the run log. This compatibility is also the reason why by default partial
logs inside the ZIP are are stored compressed with the extension .qrz. This
is slightly less efficient than storing uncompressed .qrl files, but that
way a .qzp run log can be unzipped without its overall size exploding.
To make use of split run logs you can explicitly define points at which a run log is broken and split into parts. This is done via the Name for separate run log attribute of Data driver, Test case, Test set, Test call or Test step nodes. When used with a Data driver, the logs for each iteration are saved separately, in the other cases the node with the Name for separate run log attribute is split off. Otherwise partial run logs are split off automatically when they reach a certain size. This functionality can be configured via the option Minimum size for automatic splitting (kB).
When working with split run logs it is advisable to turn Create compact run log off, in order to keep all details in the run log. This will consume a bit more disc space, but is very helpful when analyzing errors.
Split run logs are also very handy for tracking the progress of a test in batch mode. In that context it is extremely useful that the file names for the partial logs can be created using the same placeholders as when specifying the name of the main run log on the command line. In particular the error state of the partial log can be made part of its filename. Please see the documentation for the attribute Name for separate run log for details.
7.1.7 Run log options
There are several options affecting the creation of run logs and their content. Among others, you can choose whether to create compact or detailed run logs, whether to log screenshots of the whole screen and/or the client windows or whether to suppress run logs altogether. All options are explained in detail in "Run log options".
7.1.8 Creating a test suite from the run log
If several people are involved in the test development process, it might be useful to generate a test suite from the run log directly. The generated test suite could be used to reproduce a test run on-the-fly without having the entire structure of test suites.
You can create a test suite from the run log via performing a right mouse click at any node in the run log and selecting »Create test suite« from the context menu.
QF-Test creates a new file containing all executed steps of the respective tests under Extras as well as the used components.
Note QF-Test only adds the executed steps to the new test suite. Variables will be expanded immediately, so you can only see their value in the new file. Organizational nodes like procedures or control structures will not become created.
You have to set a couple of options in order to get this feature properly working (Under Run log -> Content):
- Create compact run log needs to be switched off.
- Log variable expansion needs to be switched on.
- Log parent nodes of components needs to be switched on.
If you have access to all test suites, you can use also use information from them for creating the new one. Therefore select »Create test suite from existing structure« from the context menu. In contrast to the approach described above, it is not required to switch on the option Log parent nodes of components.
7.1.9 Merging run logs
During test development you might face the requirement, that you have a run log with the test results for your test-cycle. But in several cases you might need to rerun one test case which was failing due to subtle reasons during the previous test run. Once that rerun has taken place you would like to update your test-report to have that new execution in that test-report instead the previous one. For this purpose it's possible to merge run logs via command line.
A typical merge command looks like this:
qftest -batch -mergelogs -mergelogs.mode=replace -mergelogs.masterlog full_log.qzp -mergelogs.resultlog newresult_log.qzp rerun.qzp
The command above takes the result of the rerun from the run log rerun.qzp, searches for the test case in the
run log full_log.qzp and store the updated run log to newresult_log.qzp. If you set the
parameter mergelogs.mode to merge the new test cases will be added to the existing structure
and the original test cases will remain in the run log.
Another case might be to add run logs of several test runs into one large run log in order to get a more readable report. This kind of merging is also implemented and can be achieved by another command line call like this:
qftest -batch -mergelogs -mergelogs.mode=append -mergelogs.resultlog newresult_log.qzp run1.qzp run2.qzp
The call above takes the run logs run1.qzp and run2.qzp and creates a run log newresult_log.qzp
which contains the results from both run logs. In this mode the parameter mergelogs.masterlog is optional.
If the parameter is set, the corresponding run log will be used as a root for a resulting run log.