
 Videos
 QF-Test Blog
 Manual
 Tutorial
 FAQ
5.12 Inspecting components
Sometimes it is useful to get extra information about the components saved in the section Windows and components or to view the saved information interacting directly with the application.
It is particularly relevant when mapping components of web applications. This should be done before starting to write tests, as described in Improving component recognition with a CustomWebResolver. The UI inspector can be used to examine the UI elements, currently for Android and web applications.
When working with scripts, it is sometimes helpful to be able to display a list of the methods of a GUI element.
5.12.1 Show methods
Every GUI object has certain (public) methods and fields which can be accessed in a SUT script as soon as it has access to the object (see "Accessing the SUT's GUI components"). To display these, select the »Show methods for component...« from the context menu of a node below the Windows and components branch or right-click the component itself in component recording mode (see "Recording components").
Web
The methods and fields that are displayed for HTML elements in a browser
cannot be used directly with the object returned by rc.getComponent().
They are JavaScript methods and properties that must be embedded in callJS
(see "Pseudo DOM API").
7.0+5.12.2 UI Inspector
The UI inspector shows the component hierarchy of the client and the properties of every component. This can be useful to resolve component recognition problems. Furthermore, it also makes it easier to set up resolvers thanks to the information displayed in the detailed view.
 In April 2024, a special webinar took place about this topic. Here you can find
the special
webinar video recording available on our QF-Test YouTube channel.
The UI Inspector is available for Android and Web applications. As of QF-Test version 7.1, Windows and Swing/AWT are also supported and from version 7.1.3, FX is also supported.
The node representation in the component tree will already give an overview of the most important information. If the class name ("Class") is written in blue, the component will be considered as interesting. This in turn will determine whether a Component node will be created for the component. In case a generic class (see "Generic classes") can be determined, the generic class will be represented in bold. Furthermore the original class will be added in brackets. By default, all generic classes will be regarded as interesting. Invisible components will be displayed in grey.
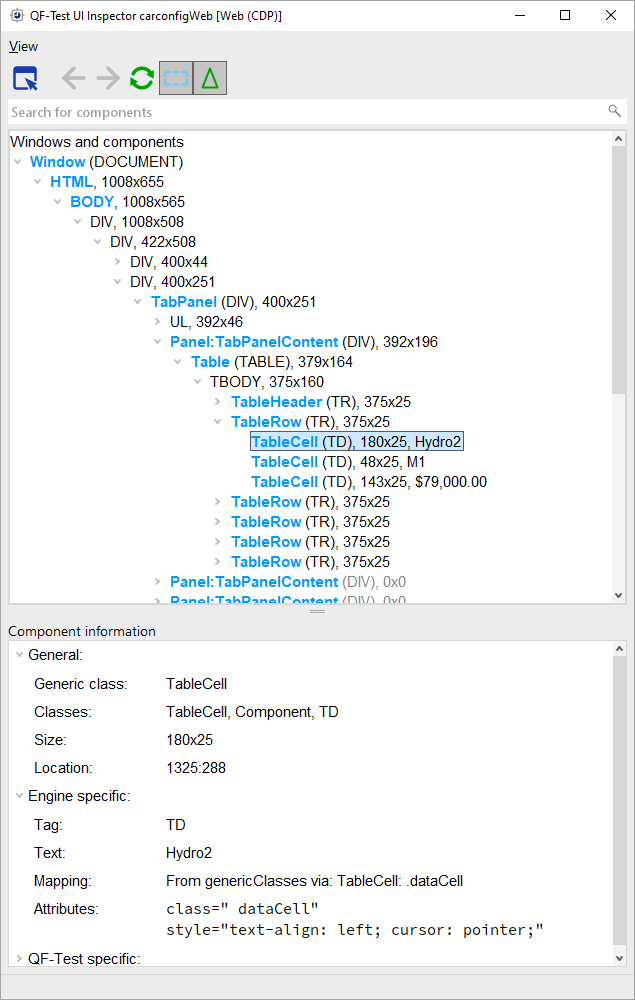
Opening the inspector
In order to open the UI inspector you have the following possibilities:
- Via the menu »Clients«-»Show inspector«.
- Via the menu entry »Show inspector« in the context menu upon component recording.
- Via the context menu »Show inspector« of any Component node or any node containing a QF-Test component ID or a SmartID.
- Directly from the SUT via (configurable) keyboard shortcuts. By default Umschalt+Strg+F11 for Windows/Linux and ⌃⇧+F11 for Mac. See "UI Inspector".
- Web Via the button »Inspector« in the Install CustomWebResolver node.
- Android In the recording window via the crosshairs-button in the toolbar, see QF-Test Android recording window.
UI Inspector toolbar
The buttons in the toolbar have the following meaning:

|
Select a component to inspect it. During component selection, the record- and check functionality of QF-Test is deactivated. Furthermore actions will not be forwarded to the SUT. That way the information in the UI inspector can be analysed via mouse clicks. | |


|
Navigating in the component tree. Together with inspector mode the history function also gets activated, thus remembering selections made in the UI inspector and the client, which makes it possible to jump forward and backwards in the component tree. | |

|
Refresh component tree. Updating is required when components have changed or an resolver has been installed. | |

|
Show invisible components in the component tree. Components with visible childs will always be displayed. | |

|
Show geometry information in the component tree. |
11.1+Searching and filtering the component tree
Above the component tree there is a search field for finding components in large hierarchies. The field works in two modes which you can switch with the two buttons at its right edge:
-
Search mode
 : Press Return to search for the entered
text. All matching components are marked in yellow and the first hit is selected. The tree remains
complete, so the hits are shown in their context. The search text may contain the wildcards
*(any number of characters) and?(exactly one character). The search ignores case unless the search text contains capital letters. -
Filter mode
 : Press Return to turn the entered text into a
filter chip below the field and to clear the field. The tree is reduced to the components matching at
least one of the chips, plus their parent components. Matching components get a light blue background
and the text of the matching chip(s) in brackets in front of them. Chips are matched as plain text,
ignoring case, wildcards are not supported. A chip is removed via its remove icon. As soon as the last
chip is gone, the complete tree is shown again.
Search and filter can be combined: the chips determine which components are shown, the search text marks hits among them. If a component is both a search hit and a filter hit, the yellow search color is shown. The reset button (cross) at the field, which is only shown while the field contains text, clears the search text only. The button next to the chips removes all chips only and is only shown while there are at least two chips. Escape clears the search text and removes all chips. Search text and chips are kept when the component tree is refreshed. The most important shortcuts are listed in "UI Inspector".
The menu »Search Scope« defines which information is searched. It can be set separately for the text search (Text search covers up to) and for the filter (Filter covers up to). The levels build on each other:
- General
- The text shown for the component in the tree and the information of the general section of the details view: generic class, classes, size and locations.
- Technical details
- Additionally the information of the engine-related section of the details view.
- QF details (without SmartID)
- Additionally the information of the QF-Test specific section: name, feature, id and extra features. The SmartID is not searched.
By default the text search covers up to the QF details, the filter only the general information. The higher levels need more information from the client: If the component tree was loaded without that information, it is reloaded once when a search or filter needs it. The technical details of all components are then collected together with the component tree, the QF details are collected with extended information. For very large component trees this reload may therefore take longer. If this is a problem, select a lower level.
UI Inspector details
The UI inspector view gives an overview of the most important properties of a component. The view is divided into three sections:
- General
- This section covers the basic properties of a component, for example its class.

Figure 5.15: General information - Engine-related
-
The engine-related details cover additional technical information of a component. The information shown differs depending on the technology used.
Web For web applications it is information about the DOM element, for example the HTML tag, HTML attributes and the readable text.
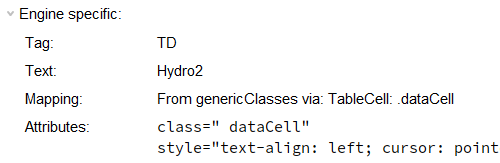
Figure 5.16: Web-specific information Android For Android applications information concerning the content description, resource ID, package name as well as information about the window type and its arrangement is shown.
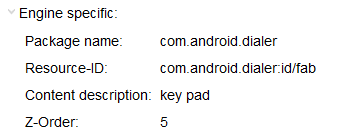
Figure 5.17: Android-specific information Windows-Tests In Windows applications, the information pertains to the Automation Element and includes the most important UI Automation properties. Detailed descriptions of this information can be found in "The WinControl class".
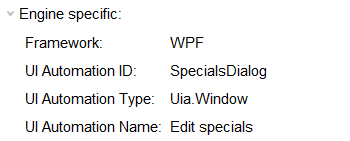
Figure 5.18: Windows-specific information Swing In Swing applications, the UI inspector contains information about the Swing component and its key accessible properties as well as the name, tooltip, and client properties.
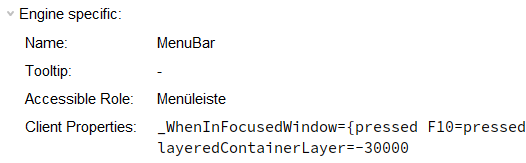
Figure 5.19: Swing-specific information JavaFX In FX applications, the UI inspector contains information about the FX component and its key accessible properties as well as the id, style, tooltip, and client properties.
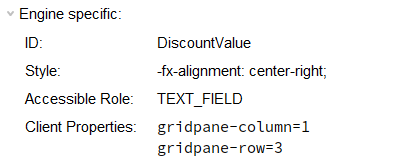
Figure 5.20: FX-specific information SWT In SWT applications, the UI inspector contains information about the swt widget such as data, tooltip, font, visibility, and enabled status.
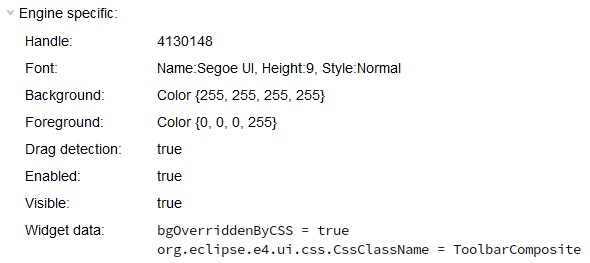
Figure 5.21: SWT-specific information - QF-Test specific
-
The information shown in this section relates to the Component node node. The information can be used to verify whether a resolver works as expected.
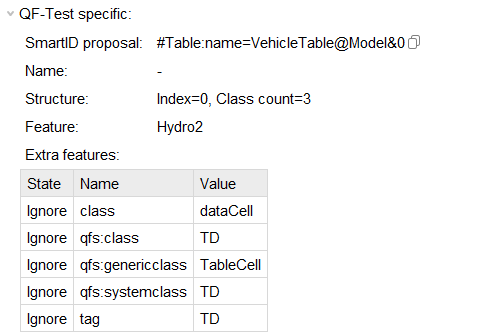
Figure 5.22: QF-Test specific information The detail view can also show information about two different components next to each other, making it easy to compare them. So right click one component in the hierarchy tree and choose »Compare« from the context menu. Via »Reset comparison« in the context menu or via the 'Close' button in the detail view you can leave the comparison mode again.
11.1+While a search or filter is active, the terms are highlighted in the details view: search text in yellow, filter chips in light blue. Only values of those sections are highlighted that are covered by the selected »Search Scope«, labels and the SmartID are never highlighted.